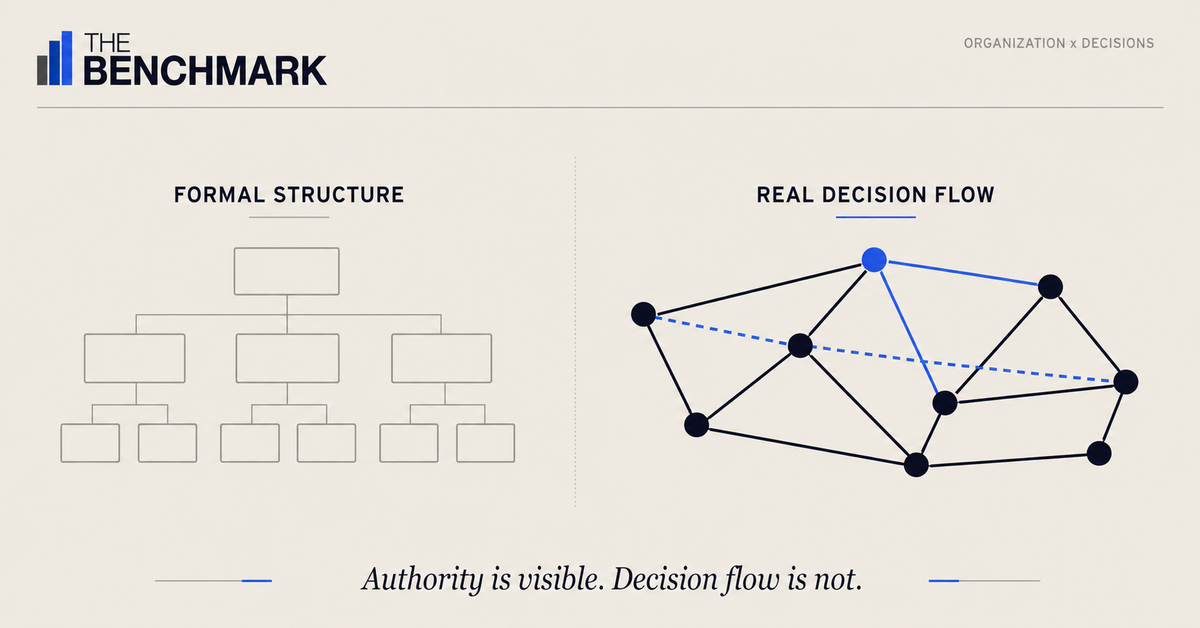
Your Org Chart Is Fiction
The formal structure says who reports to whom. The real operating model shows how work actually moves.
A CFO approves a $2 million automation budget in January. By March, three teams have bought different tools to solve the same problem. Each purchase followed a legitimate local approval path. No one violated policy. No one intended to create duplication.
The org chart says the CFO controls capital allocation. The real operating model says the decision happened earlier, in Slack threads, project backlogs, vendor demos, and manager-level workarounds the formal system never saw.
That gap is where execution breaks down. Most companies still manage according to the visible structure: reporting lines, budget owners, governance forums, and planning calendars. But work increasingly moves through another system: informal networks, tool-shaped workflows, hidden decision rights, and overloaded managers making local calls under pressure.
The org chart is not wrong. It is incomplete. The question is whether leadership is managing the system that actually runs the company.
Table of Contents
The Formal Model Is No Longer a Reliable Map
For much of the 20th century, the org chart was an imperfect yet useful proxy for how work got done. Hierarchy, physical proximity, and functional boundaries kept the formal structure close enough to the operating reality. People sat near the people they worked with. Escalations moved up visible chains. Budget authority and decision authority were usually connected.
That world has been dissolving for years.
Distributed work weakened the informal ties that once helped the formal structure function. Microsoft's 2022 Work Trend Index found that hybrid and remote employees reported fewer work friendships, a proxy for the erosion of weak ties that move information across boundaries. MIT's Senseable City Lab found that weak ties among MIT researchers dropped sharply within days of campus closure, producing thousands of lost connections over the study period.
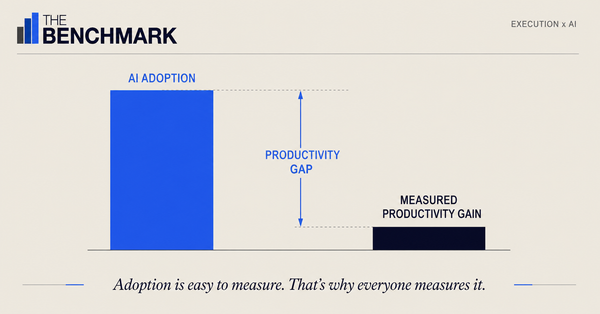
AI and tool proliferation widened the gap. Asana's 2025 research on the AI productivity paradox found that many high-productivity workers said AI created more coordination work, not less. Faros AI data published with the DORA research showed that individual software output could rise while delivery performance stayed flat because review time, bugs, and coordination load increased.
That hidden operating model is not the structure on the slide. It is the network of decisions, workflows, tools, and human judgment that determines whether work actually moves.
The Real Operating Model Has Four Components
The real operating model has four components. None of them appears cleanly on the org chart.
The first is decision architecture: where decisions actually get made, who has authority, what criteria trigger escalation, and which decisions are made before formal governance ever sees them.
Most organizations overestimate how clear this is. A product team believes it owns roadmap sequencing. Finance believes it owns budget release. Operations believes it owns capacity. Legal believes it owns risk thresholds. The org chart shows functional accountability. The work depends on decisions that cross those boundaries.
When decision architecture is unclear, teams do not wait. They make local decisions. Some are good. Some are defensible. Some create conflicts that senior leaders discover only after the work has already hardened into a plan.
The second component is workflow reality: how work actually moves from request to decision to execution. Process documents describe the official route. The real workflow includes shortcuts, delays, workarounds, duplicated tools, manual checks, and informal escalation paths.
AI makes workflow reality more important because it can accelerate whatever workflow it touches. A broken process does not become redesigned because a model enters it. It becomes faster. If the workflow contains hidden rework, unclear handoffs, or downstream bottlenecks, AI may increase the volume of work entering the bottleneck rather than relieve it.
The third component is role load: the actual burden carried by the people through whom the system operates. This is most visible in the manager layer. Gallup's 2026 span-of-control research shows managers overseeing more direct reports than in prior years, with many carrying heavier coordination and individual contributor loads. The formal role description may not have changed. The real job has.
The fourth component is network health: the strength of the ties that move information, trust, expertise, and dissent. Strong teams can still fail when weak ties decay. Information stays local. Expertise does not travel. Problems that require cross-functional detection arrive late.
Together, these four components explain why reorgs so often disappoint. Leaders move reporting lines but leave decision architecture, workflow reality, role load, and network health untouched.
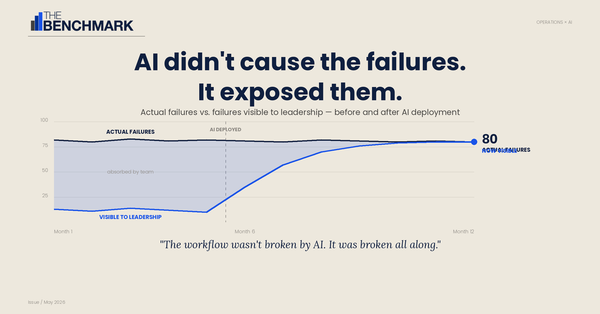
AI Is Diagnostic, Not the Problem
AI is making this gap easier to see by increasing the speed of local action.
A team that once needed three weeks to produce an analysis can now produce it in three days. A product group can generate more specs. Engineering can open more pull requests. Marketing can create more campaigns. Finance can model more scenarios.
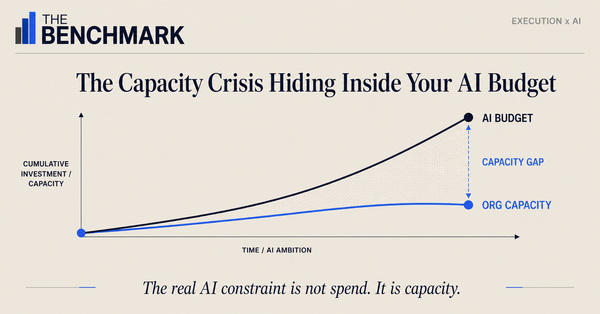
That looks like productivity until the rest of the operating model has to absorb it.
California Management Review has described this failure mode clearly: local productivity can become counterproductive when output exceeds the rest of the system's capacity. A task can be completed faster and still slow the organization if downstream review, decision rights, or coordination capacity do not change.
This is the difference between individual throughput and organizational throughput. The org chart does not show the difference. It shows who owns the people. It does not show whether the system can absorb the work that those people now produce.
AI is not creating the hidden operating model. It is revealing it. Companies with clear decision rights, clean workflows, realistic role design, and healthy networks will absorb AI more effectively. Companies without those conditions will generate more work, more rework, and more coordination load.
The diagnostic question is simple: when AI makes a local team faster, what breaks next?
Clarity Decay Is Not a Communication Problem
Leaders often respond to operating-model confusion with more communication. More town halls. More dashboards. More weekly updates. More summaries. More alignment meetings.
Some of that helps. Most of it misses the problem.
The issue is not that people lack information. It is that they lack operating clarity. They do not know which decision has already been made, which tradeoff is real, which metric wins when functions disagree, or where their authority ends.
That is why communication volume can rise while clarity falls. The organization becomes louder but not more coherent.
A company can have a beautiful strategy narrative and still operate through hidden decision rights. It can have a clean org chart and still rely on managers to resolve contradictions without authority. It can have a modern AI roadmap and still run on workflows designed for a prior operating model.
The result is execution drift. Teams do what makes sense locally. Functions optimize their own constraints. Managers absorb the contradictions. By the time the conflict reaches senior leadership, the organization is already committed.
The real operating model has already made the decision.
Where This Argument Gets Complicated
The org chart is not obsolete. Reporting lines still matter. Accountability matters. Legal authority matters. Budget ownership matters. A company cannot run on informal networks alone.
The mistake is treating the org chart as sufficient.
Formal structure is necessary because someone must be accountable. But accountability without operating visibility becomes theater. Leaders can name the owner of a function without understanding how the work moves through the system. They can redraw reporting lines without changing the decisions, workflows, role loads, or networks that created the problem.
The strongest organizations do not abandon formal structure. They supplement it with operating-model visibility. They manage the chart and the system beneath it.
Implications for Leaders
Audit decision architecture before the next reorg.
Pick one cross-functional decision that routinely slows execution. Map where the decision is supposed to happen, where it actually happens, who influences it, what information is used, and what criteria determine escalation. If the answer is unclear, the structure is not the problem yet. The decision architecture is.
Map one critical workflow end-to-end.
Do not map the documented process. Map the actual one. Include informal approvals, duplicated tools, rework loops, manual checks, and exceptions. Then ask what would happen if AI accelerated each step by 30%. The bottleneck that appears is the risk of operating model.
Measure role load, especially in the manager layer.
Span of control is not an HR detail. It is an execution variable. If managers are carrying too many direct reports, too much administrative load, and too many cross-functional translation duties, the operating model is using them as shock absorbers. That is not sustainable.
Make network health visible.
Weak ties, cross-functional relationships, and informal flows of expertise are part of the execution infrastructure. Track collaboration patterns, onboarding quality, knowledge transfer, and cross-functional problem-solving. If information only moves through formal meetings, the network is already brittle.
Treat AI deployment as an operating model test.
Before scaling AI into a workflow, ask what it will reveal about decision rights, handoffs, and downstream absorption. If no one owns the full workflow, no one owns the AI outcome.
The Bottom Line
The org chart still matters. It just no longer explains enough.
The formal structure tells leaders who reports to whom. It does not show where decisions actually get made, which workflows people bypass, where role load has become unsustainable, or which informal networks carry the information the company depends on. Those hidden systems have always existed. Distributed work, AI, and tool proliferation have made them more powerful and less visible.
A reorg will not fix a company whose real operating model is unmanaged. The work is more specific: map decision architecture, inspect workflow reality, measure role load, and protect network health. Leaders do not need a prettier chart. They need a better view of the system people are already using to get work done.
Sources
McKinsey & Company. "The New Rules for Getting Your Operating Model Redesign Right." June 2025. https://www.mckinsey.com/capabilities/people-and-organizational-performance/our-insights/the-new-rules-for-getting-your-operating-model-redesign-right
McKinsey & Company. "A New Operating Model for a New World." June 2025. https://www.mckinsey.com/capabilities/people-and-organizational-performance/our-insights/a-new-operating-model-for-a-new-world
Gallup. "Span of Control: What's the Optimal Team Size for Managers?" January 2026. https://www.gallup.com/workplace/700718/span-control-optimal-team-size-managers.aspx
Gallup. "The Great Detachment: Why Employees Feel Stuck." 2025. https://www.gallup.com/workplace/653711/great-detachment-why-employees-feel-stuck.aspx
Santi et al. "The Effect of Co-location on Human Communication Networks." Nature Computational Science, August 2022. https://www.nature.com/articles/s43588-022-00296-z
MIT News. "Analysis of Email Traffic Suggests Remote Work May Stifle Innovation." September 2022. https://news.mit.edu/2022/remote-work-may-innovation-0901
Asana. "The AI Super Productivity Paradox." 2025. https://asana.com/resources/ai-super-productivity-paradox
Faros AI. "Key Takeaways from the DORA Report 2025: AI Impact on Dev Metrics." September 2025. https://www.faros.ai/blog/key-takeaways-from-the-dora-report-2025
California Management Review. "AI Productivity Blind Spot." January 2026. https://cmr.berkeley.edu/2026/01/ai-productivity-blind-spot/